
112 Online Review Statistics for 2026, Each One Explained
 By Axel
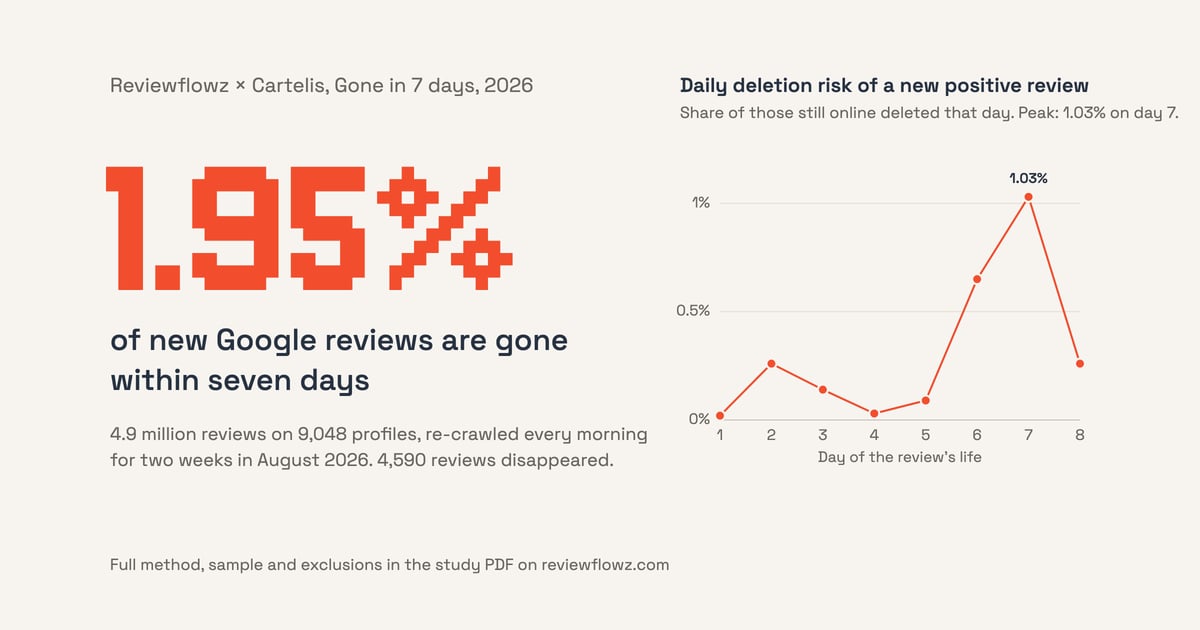
Every number in this article comes from one of ten primary sources, and our own study of 4.9 million Google reviews on 9,048 profiles comes first (Reviewflowz × Cartelis, Gone in 7 days, 2026). The other nine are a consumer survey, two platform transparency reports, two trust reports, an expert survey and three academic studies. Each one is named and linked every time it is used, and every number is explained.
It runs in eight sections. Getting reviews covers who writes them, what asking does, and the volumes the platforms handle. Replying to reviews measures what a reply changes, on the review, on the business and for the reader. What Google deletes is the study: which reviews go, when, and where. Fake reviews and enforcement is what the platforms remove and how. Reviews and rankings covers the local pack, organic and AI search. How people read reviews is where they read, on what, and what makes one count. What reviews are worth puts trust, decisions and revenue on them. What a profile needs closes with count, recency and rating.
Each item opens with its number and the headline statistic in bold, then the source in parentheses with a link, then three or four lines on what the number means, what it does not mean, and how to read it. The caveats live there: the base, the population, what was controlled for, and where the arithmetic is ours. The list runs from 1 to 112 across the eight sections.
Getting reviews: who writes them, asking, volume

1. Businesses whose reviews name staff collect 2.7 times more reviews a year than businesses where names are rare. (Reviewflowz × Cartelis, Gone in 7 days, 2026) That is at equal sector, region and size. They also lose more, 13 reviews per 100 gained against 8, and still end the year with twice the net reviews. The number compares businesses, not reviews, so it does not say that a name on a review causes anything. It says that the businesses whose customers name people collect more, lose more, and keep more.
2. 28% of positive Google reviews name a person. (Reviewflowz × Cartelis, Gone in 7 days, 2026) The share is 38% in the US and 13% in Europe, 66% in US home services and about 7% in hospitality. Three quarters of those names recur across reviews of the same business, which marks them as staff. So the figure is mostly staff, not one-off mentions, and it depends far more on country and sector than on any average.
3. Name-heavy businesses collect 10 reviews a month against 5 for the others. (Reviewflowz × Cartelis, Gone in 7 days, 2026) A business whose share of named reviews rose by 25 points collected 36% more reviews year on year in those months. The second number tracks the same businesses over time, so it is stronger than the first, which compares different businesses. Neither number says what the business did to get there.
4. 14% of Google reviews come from an account writing its first review. (Reviewflowz × Cartelis, Gone in 7 days, 2026; Trustpilot, Trust Report 2025, 2025) Trustpilot saw 22 million first-time reviewers in 2024, up 13%. First reviews are a normal part of the stock, not a warning sign in themselves. Keep the 14% in mind for item 38, where the same accounts turn up in a larger share of deletions.
5. 9% of Google reviews are one or two stars. (Reviewflowz × Cartelis, Gone in 7 days, 2026; BrightLocal, Local Consumer Review Survey, 2026) BrightLocal finds the same skew on the writing side: 60% of US consumers wrote a positive review in the last 12 months and 29% a negative one. The 9% is the stock on 9,048 profiles, so it describes what a reader sees, not how any one business performs. Use it as the baseline a single profile is compared against.
6. 78% of US consumers were asked to leave a review in the past 12 months, and 83% of those asked did. (BrightLocal, Local Consumer Review Survey, 2026) Both are self-reported in a survey, so they measure what people remember and say, not what happens on a profile. Read them together: asking is common and it works. The 83% applies to people who were asked, not to all consumers.
7. 28% say they will always write a review if asked, up from 16% in 2025. (BrightLocal, Local Consumer Review Survey, 2026) The headline is the jump, not the level. A stated intention runs ahead of behaviour, so do not plan on 28% of requests turning into reviews. What it supports is a steady ask: the share of people who say yes by default is growing.
8. 69% of US consumers wrote a business review in the last 12 months. (BrightLocal, Local Consumer Review Survey, 2026) The typical consumer writes 4 to 6 a year. 20% wrote more than 10, and 7% more than 50. The distribution matters more than the average: a small group writes a large share of the volume.
9. Google collects reviews from 45% of US consumers, Facebook 34%, Yelp 24%, Apple Maps 17%, Tripadvisor 16% and BBB 16%. (BrightLocal, Local Consumer Review Survey, 2026) These are the platforms people say they wrote on in the last year. They add up to more than 100% because many people write on several. The gap between Google and the rest is the point, and Apple Maps at 17% is worth noting next to its reading share in item 76.
10. 27% of US consumers were offered a discount for a review, down from 36% in 2025 and 45% in 2024. (BrightLocal, Local Consumer Review Survey, 2026; Tripadvisor, Transparency Report, 2025) 11% were offered something for a positive review specifically. On the enforcement side, Tripadvisor warned around 9,000 businesses for incentivised reviews in 2024 and removed 360,000 reviews tied to staff incentive programmes. The two numbers sit side by side: incentives are falling, and platforms act on them.
11. Verified buyers rate higher: 4.34 stars on average against 3.89 for anonymous reviewers. (Spiegel Research Center, How Online Reviews Influence Sales, 2017) Measured on 122,000 reviews of 13,500 products. The study does not say why. The gap is between two populations of writers, not an effect of the badge on the same writer, so read it as a selection effect and as a reason verified reviews read as more positive.
12. Who writes it matters twice: a Yelp elite reviewer's rating has roughly double the revenue impact of anyone else's, and on Google a review from a Local Guide of level 6 or more is deleted 0.59 times as often as one from levels 1 to 3. (Luca, Reviews, Reputation, and Revenue (Harvard Business School), 2016; Reviewflowz × Cartelis, Gone in 7 days, 2026) The Google figure is inside the same business, so it is not a mix of sectors. The two numbers come from different platforms and different years and do not compound. Together they say that reviewer status counts for readers and for the platform's filters.
13. Trustpilot took 61 million reviews in 2024, up 15%, almost 200,000 a day, and Google published more than 1 billion reviews on Maps in 2025. (Trustpilot, trust page, 2026; Google, Maps Trust and Safety update, 2026) Scale numbers, not comparable ones: Trustpilot counts submissions in a year, Google counts what it published after screening. Use them to size the platforms, not to rank them. Google's figure pairs with the 292 million it blocked or removed in item 48.
14. Tripadvisor received 31.1 million reviews in 2024, and owners responded to over 11 million reviews that year. (Tripadvisor, Transparency Report, 2025) The response count covers all reviews, not only the year's new ones, so do not divide one by the other. What the pair shows is that owner replies are routine on Tripadvisor.
15. 94% of US consumers are open to writing a review, and 6% say they would not. (BrightLocal, Local Consumer Review Survey, 2026) Openness is not action: 69% actually wrote one in the last year (item 8). The gap between 94 and 69 is the room an ask has to work with. The 6% is the share no ask reaches.
Replying to reviews
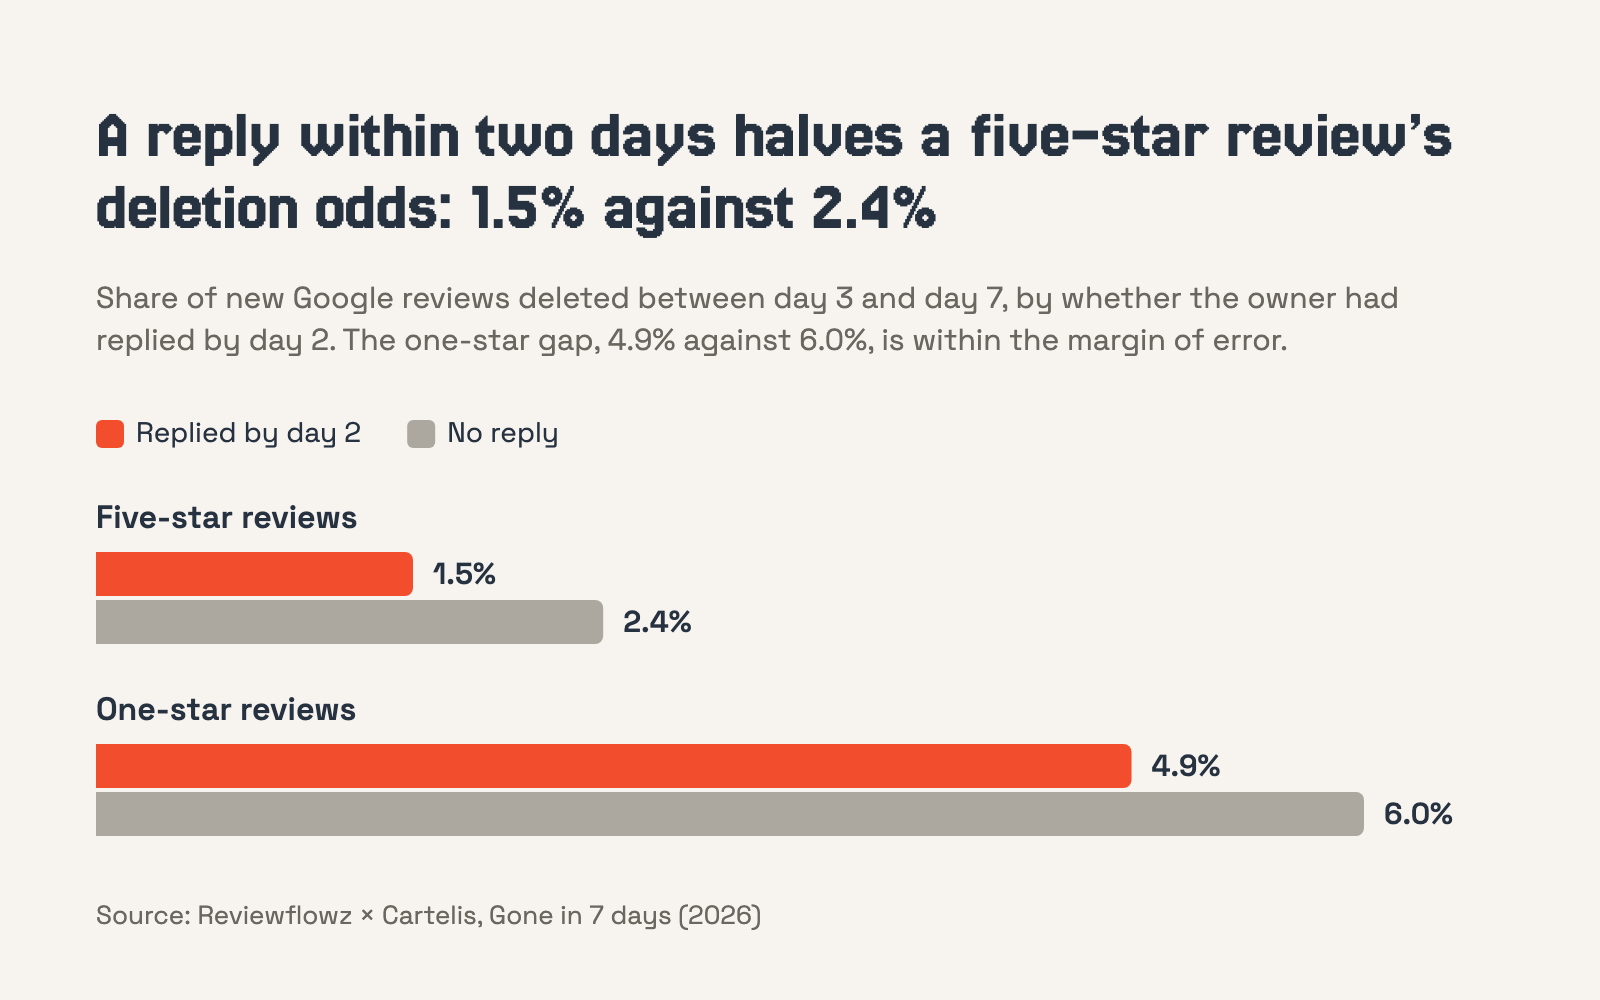
16. A reply within two days halves the deletion odds of a positive Google review. (Reviewflowz × Cartelis, Gone in 7 days, 2026; Localo, 2026) 1.5% of replied five-star reviews were deleted between day 3 and day 7 against 2.4% of unreplied ones, 0.51x at equal sector and size. Localo says a quick response does not protect, because 60.1% of the deleted reviews in its dataset had a reply. That is not a measurement of protection. Localo's dataset is its own clients' profiles, and clients of a review management tool reply far more than the average business, so most of their reviews, deleted or not, carry a reply. The share of deleted reviews with a reply says nothing unless you know the share of surviving reviews with a reply, and Localo has no surviving reviews to compare against. We compared replied and unreplied reviews of the same age in the same businesses, and the replied ones survive more.
17. Speed inside the window does not matter: a same-day reply gives 0.46x the deletion odds, next day 0.52x, day two 0.51x. (Reviewflowz × Cartelis, Gone in 7 days, 2026) The three figures sit within a hair of each other. Replying does the work, racing does not. Read it as a two-day window, not a stopwatch: a reply on day two protects a positive review about as well as one within the hour.
18. The protection sits on the review, not the business. (Reviewflowz × Cartelis, Gone in 7 days, 2026) On the whole stock, a replied review is deleted 0.72 times as often inside the same business. Yet businesses that reply to none of their reviews lose reviews at the same rate as those replying to three quarters or more. So a high reply rate does not shield a profile. Each reply shields the review under it, and only that one.
19. Replies do not save negative reviews. (Reviewflowz × Cartelis, Gone in 7 days, 2026) 4.9% of replied one-star reviews were deleted in days 3 to 7 against 6.0% of unreplied ones, and that gap is within the margin of error. Reply to a one-star review for the reader, not for Google. The effect in item 16 is a five-star effect.
20. Hotels that start responding to reviews gain 0.12 stars and 12% more reviews a month. (Proserpio and Zervas, Online Reputation Management (Marketing Science), 2017) Measured on 1,762 Texas hotels against the same hotels' Expedia pages, where they never respond, so each hotel is its own control. 27% crossed a half-star threshold within six months. It is a hotel study on TripAdvisor. The figures are theirs, and item 21 explains where they come from.
21. The mechanism is selection, not quality. (Proserpio and Zervas, Online Reputation Management (Marketing Science), 2017) After a hotel starts replying, the chance of a one-star review falls nearly 2%, the chance of a five-star rises about 7%, and the negative reviews that still come in are about 10% longer. The rating gain comes from who posts and what they post, not from better stays.
22. A dissatisfied guest who gets a reply is 43% more likely to come back and review again. (Proserpio and Zervas, Online Reputation Management (Marketing Science), 2017) That guest also rates the second stay 0.57 stars higher than a guest who got no reply. The comparison is between replied and unreplied dissatisfied guests, so it isolates the reply. It does not say the reply fixed the problem. It says the reply changed what the guest did next.
23. Managers answer negative reviews first: the first review a hotel ever replies to averages about 3 stars, and by its 20th reply the review averages nearly 4. (Proserpio and Zervas, Online Reputation Management (Marketing Science), 2017) Response lag fell from almost 10 months in 2009 to 25 days in 2013. The pattern is adoption: hotels start by firefighting and widen to positives as replying becomes routine. The numbers describe TripAdvisor hotels in that period, not a rule about what to reply to.
24. Where replies are possible, they happen: 31.5% of TripAdvisor reviews of Texas hotels carried a response by 2013, against 2.3% on Expedia. (Proserpio and Zervas, Online Reputation Management (Marketing Science), 2017) Same hotels, same guests, two platforms with different reply tools. The gap is the platform, not the manager. It is also what makes the Expedia pages a clean control in item 20.
25. 80% of US consumers say they are likely to use a business that responds to all of its reviews. (BrightLocal, Local Consumer Review Survey, 2026) 42% are unlikely to use one that never responds. Both are stated preferences in a survey, not observed behaviour. Read them as the reader's expectation: a complete reply record earns intent, silence loses it. Neither number is a sales figure.
26. 50% of US consumers are put off by generic or templated replies. (BrightLocal, Local Consumer Review Survey, 2026) Replying only to positives (45% likely to use the business) or only to negatives (47%) scores about the same, and both sit well under the 80% for replying to everything. The template is the risk, not the selection. A reply that reads as a form loses half the readers it was meant to win.
27. 89% of US consumers expect a response to their own review. (BrightLocal, Local Consumer Review Survey, 2026) 19% expect it the same day, up from 6% in 2025. 32% expect it by the next day, up from 18%. 81% expect it within a week. The level is stable and the clock is tightening. Set the reply window against the 81%, not against the same-day minority.
28. 37% say an owner response is one of the things that makes a review matter to them. (BrightLocal, Local Consumer Review Survey, 2026) That puts it fifth of ten factors, behind the things in item 83. It is a reader-side number: a reply makes the review under it more credible to the person reading it. It says nothing about rankings, which item 29 covers.
29. Replies convert, they do not rank. (Whitespark, Local Search Ranking Factors, 2026) Whitespark's experts put owner responses to most reviews at #122 of 187 local pack ranking factors but #17 of 120 conversion factors, and keywords in owner responses are the sixth-biggest local SEO myth. This is an expert survey, not a measurement. Read it as the consensus of people who do this for a living: reply for the reader, never for the algorithm.
30. Hotels that respond already sit 0.5 stars higher than hotels that do not, before the responding effect is counted. (Proserpio and Zervas, Online Reputation Management (Marketing Science), 2017) That holds on both TripAdvisor and Expedia, so it is the hotel, not the replies. Responders are a self-selected group. Item 20 is the effect net of that, which is why it is 0.12 stars and not 0.5. Any comparison of responders to non-responders without this control overstates replying.
What Google deletes

31. 1.95% of new Google reviews are gone within seven days. (Reviewflowz × Cartelis, Gone in 7 days, 2026; Google, Maps Trust and Safety update, 2026; Localo, 2026) We re-crawled 4.9 million reviews on 9,048 Google profiles every morning for two weeks and watched 4,590 disappear. Google says it blocked or removed over 292 million policy-violating reviews in 2025 against more than 1 billion published. Localo reports deletions in its dataset growing 28x between Q4 2023 and Q4 2025. That dataset only covers profiles Localo tracks, and the number of tracked profiles grew with its customer base, so the 28x is growth in the sample, not in Google's deletions.
32. A new review's deletion risk peaks on days 6 and 7, then falls tenfold after day 8. (Reviewflowz × Cartelis, Gone in 7 days, 2026) That holds whatever the weekday it was posted, so it is a clock on the review, not a weekly sweep. 47% of positive reviews deleted in their first 13 days go on day 6 or 7. A positive review that reaches day 8 has passed its peak risk. Day 7 is the date to watch, not the day of posting.
33. Negative reviews are screened earlier: deletions of one-star and two-star reviews peak on days 2 and 3. (Reviewflowz × Cartelis, Gone in 7 days, 2026) Positives peak on days 6 and 7. Two clocks, then, and the negative one runs faster. A one-star review still there on day 4 has passed its peak risk. For a five-star, the equivalent date is day 8.
34. Half of all deletions hit reviews under 30 days old. (Reviewflowz × Cartelis, Gone in 7 days, 2026) A third hit reviews over a year old, and the median deleted review is about a month old. So deletion is mostly a new-review event, but not only: old reviews go too, and item 39 shows one reason. Do not read the half as a rate. It is the age mix of what disappears.
35. A review under two weeks old is about 100 times more likely to be deleted than a review over three years old. (Reviewflowz × Cartelis, Gone in 7 days, 2026) The ratio compares the two ends of the age range, so it says little about a six-month-old review. What it says is that nearly all of the risk a review faces comes in its first days, and that an old review faces very little.
36. One-star reviews are the most deleted: 5.7% of new one-star reviews are gone within a week against 1.8% of five-star. (Reviewflowz × Cartelis, Gone in 7 days, 2026; Localo, 2026) Inside the same business, a one-star review is deleted 3.9 times more often than a four-star. Localo's headline is that 89.1% of deleted reviews are five-star. That is a share of deletions on a platform where most reviews are five-star, taken from Localo's own clients, who collect five-star reviews on purpose. It says nothing about which rating is more likely to be deleted. At equal age in the same business, it is the one-star.
37. One-star and two-star reviews are 9% of reviews and 20% of deletions. (Reviewflowz × Cartelis, Gone in 7 days, 2026) That is the same fact as item 36 from the other side: negatives are over-represented in what goes. It also means most deletions are still three stars and up, because that is where the volume is. Losing a five-star review is the common case. Losing a one-star is the likely case per review.
38. First reviews are deleted 5.6 times more often than top Local Guides' reviews. (Reviewflowz × Cartelis, Gone in 7 days, 2026) Accounts writing their first review produce 14% of reviews and 22% of deletions. A review's survival tracks the account behind it, and a new account has no record. This does not make a first review fake. It makes it scrutinised. The 5.6x compares the two ends of the Local Guide scale.
39. One deletion in five is Google removing a whole account. (Reviewflowz × Cartelis, Gone in 7 days, 2026; Google, Maps Trust and Safety update, 2026) Of 334 deleted reviews whose author had other reviews in the panel, 64 left together with every other review by that author, 52 of them on the same day across different businesses. Google placed posting restrictions on more than 782,000 accounts in 2025. So a share of what a business loses has nothing to do with that business. The review went because the reviewer went.
40. A review posted on a spike day is deleted 1.8 times more often. (Reviewflowz × Cartelis, Gone in 7 days, 2026; Whitespark, Local Search Ranking Factors, 2026) 2.3% against 1.5% within a week, at equal sector and size. Whitespark's experts rank receiving too many Google reviews too fast as a negative ranking factor (#30 of 42) and a suspension risk (#12 of 42). A burst costs twice: more deletions, and a ranking signal against you.
41. Reviews naming a staff member are deleted at the same rate as reviews that do not: 1.01x. (Reviewflowz × Cartelis, Gone in 7 days, 2026) That is inside the same business at the same age and length, and it rules out any increase above 11%. The raw gap is 1.32x and comes from sector, pace and freshness, not from the name. Google's April 2026 policy forbids asking for reviews that name staff. It is not enforcing it.
42. Profiles with 85% or more five-star reviews lose 2.2 times more reviews than profiles at 50 to 70% five-star. (Reviewflowz × Cartelis, Gone in 7 days, 2026) 0.14% against 0.03% over two weeks, at equal sector, size and volume. The rates are small, the ratio is not. A near-perfect profile draws more scrutiny than a mixed one. Read it with item 102: perfection costs on the platform side and on the buyer side.
43. US profiles lose twice as many reviews as European ones. (Reviewflowz × Cartelis, Gone in 7 days, 2026) Home services lose 3.3 times more new positive reviews than automotive. Spain is the most exposed European country at 2.9% of new reviews gone in a week, Portugal and Romania the least at 0.4%. Geography and sector move the base rate by an order of magnitude, so compare a profile to its own country and trade, never to the 1.95% average.
44. 13% of businesses lost at least one review in two weeks, and the top 1% of businesses carry half of all deletions. (Reviewflowz × Cartelis, Gone in 7 days, 2026) 67% of businesses collecting 50 or more reviews a month were hit, against 4% of those collecting under 2. Deletion is concentrated where volume is. Most profiles see nothing in a given fortnight. The ones that collect at scale see it routinely, so a deletion is a volume event before it is a quality event.
45. Deletions cost count and recency, not rating: businesses that lost 5 or more reviews saw their average move by 0.01 star. (Reviewflowz × Cartelis, Gone in 7 days, 2026) At the observed pace a profile loses about 1.4% of its reviews a year, and 2 of 9,048 profiles were delisted. So the star rating is safe. The review count and the date of the latest review are what take the hit, and items 87 and 104 show why those two are the ones buyers filter on.
Fake reviews and enforcement

46. Google removes review bombs: two Spanish gyms received 297 one-star reviews on 1 and 2 August, and 295 were gone by 16 August. (Reviewflowz × Cartelis, Gone in 7 days, 2026) A German tour operator lost 46 one-star reviews posted between 2018 and 2026 in four days. Two cases, not a rate. They show what enforcement looks like when it works: a coordinated attack reversed within two weeks, and a years-old pattern unwound at once.
47. Enforcement works at account level: one deletion in five is a whole-account removal. (Reviewflowz × Cartelis, Gone in 7 days, 2026; Google, Maps Trust and Safety update, 2026) Google restricted more than 782,000 accounts and removed over 13 million fake Business Profiles in 2025. The unit of enforcement is the account and the profile, not the single review. For a business, it means a batch of reviews can vanish on the same day without any of them being flagged on its own.
48. Google blocked or removed over 292 million policy-violating reviews in 2025 while publishing more than 1 billion, roughly 22% of submissions by our arithmetic. (Google, Maps Trust and Safety update, 2026; Google Maps Transparency Report, 2026; Localo, 2026) Google's transparency report counts 221 million removed under the fake-engagement policy alone. That is the figure Localo quotes as Google deleted 221 million reviews, and on this one it is right. The 22% is ours, from 292 million over 292 million plus 1 billion, and it is rough: both figures are floors.
49. Google blocked 79 million inaccurate or unverified edits to Business Profiles in 2025, out of 80 million suggested. (Google, Maps Trust and Safety update, 2026) Almost every suggested edit is refused. That is the profile side of enforcement, not reviews. Suggested edits are the channel anyone can use to change a listing's facts, and Google refuses nearly all of them.
50. Trustpilot removed 4.5 million fake reviews in 2024, 7.4% of all reviews submitted, and 7.8 million in 2025. (Trustpilot, Trust Report 2025, 2025; Trustpilot, trust page, 2026) The 2023 share was 6.1%. A rising share can mean more fakes or better detection, and the report does not separate the two. Use 7.4% as a floor on what gets submitted as fake, since it counts only what was caught.
51. 90% of Trustpilot's fake-review removals were automatic, 53% more automatic removals than the year before. (Trustpilot, Trust Report 2025, 2025; Trustpilot, trust page, 2026) Every one of the roughly 200,000 daily submissions is checked before it becomes visible. So most removals happen by machine, and the check runs before a review becomes visible. A review that is live on Trustpilot has passed that filter once.
52. Of Trustpilot's 4.5 million removed fakes, 3.4 million were five-star and 627,000 one-star: fakes are mostly positive. (Trustpilot, Trust Report 2025, 2025; Reviewflowz × Cartelis, Gone in 7 days, 2026) On Google, one-star reviews have the highest deletion rate (item 36). The two measure different things: Trustpilot counts fabricated reviews, our study counts all removals, whatever the reason. Fabricated reviews skew positive. Removals on Google skew negative. Both are true at once because they count different things.
53. Businesses flag far more than consumers: 601,000 business flags in 2024 against 92,000 consumer flags. (Trustpilot, Trust Report 2025, 2025) 442,000 business flags claimed the review was not based on a genuine experience. Trustpilot cut the evidence burden on consumers after businesses abused reporting to suppress negative reviews. Read the ratio as a warning: flagging is a tool businesses use most, and the platform has moved to make it harder to misuse.
54. Trustpilot issued 19,000 warnings to businesses in 2024, up 28%, plus 5,000 cease-and-desist letters and 9,000 public consumer warnings. (Trustpilot, Trust Report 2025, 2025) It has taken 11 businesses to court since 2022. Enforcement runs as a ladder: warning, letter, public notice, court. The 11 court cases are the top of the ladder. The 9,000 public warnings are the step most businesses would feel.
55. Tripadvisor stopped 2.7 million fraudulent reviews in 2024 out of 31.1 million submitted, 8.7% by our arithmetic. (Tripadvisor, Transparency Report, 2025) 87.8% of submissions passed automation, 7.3% were rejected by it, and 4.9% went to moderators. The 8.7% is close to Trustpilot's 7.4% (item 50): two platforms, same order of magnitude. It counts what was caught, so it is a floor on fraud, not a measure of it.
56. 54% of Tripadvisor's detected fraud is review boosting: owners, employees or affiliates reviewing their own business. (Tripadvisor, Transparency Report, 2025) More than half of what gets caught is self-promotion, not attacks on competitors. The share is of detected fraud, so it also reflects what is easiest to detect. Still, the typical fake review on Tripadvisor is a business writing about itself.
57. Tripadvisor flagged and removed 214,000 AI-generated reviews in 2024. (Tripadvisor, Transparency Report, 2025) Set against the 31.1 million submissions in item 55, it is a small share. The number says detection exists and runs. It does not say how many AI-written reviews got through.
58. 63% of US consumers say review platforms should be responsible for catching fake reviews, 49% say businesses, 25% say the government. (BrightLocal, Local Consumer Review Survey, 2026) People could pick more than one. The order is the point: readers expect the platform to police itself first, and a business second. A business is not off the hook. Half of readers hold it responsible for the fakes on its own profile.
59. 97% of US consumers want businesses caught with fake reviews punished. (BrightLocal, Local Consumer Review Survey, 2026) 57% want a platform ban, 46% removal from Google search, 37% fines, 16% criminal charges, and 3% want no consequence. Fake reviews are not a grey area for readers. Whatever the enforcement risk, the reputational one is close to unanimous.
60. Review gating and fake reviews are the #6 and #7 suspension risks of 42 in Whitespark's expert survey. (Whitespark, Local Search Ranking Factors, 2026; Luca, Reviews, Reputation, and Revenue (Harvard Business School), 2016) Luca found no bunching of Yelp ratings just above rounding thresholds, so no sign that restaurants game their reviews. Two different claims: experts say gating and faking get profiles suspended, and an economist found no fingerprint of gaming in restaurant data. Gating means asking only happy customers to post, and the experts rank it next to faking.
Reviews and rankings, including AI search

61. Review signals carry 20% of local pack ranking weight in Whitespark's 2026 expert survey. (Whitespark, Local Search Ranking Factors, 2026) Up from 17% in 2023 and 15% in 2018, the largest rise of any signal group. The weights are expert estimates, not measurements of Google's algorithm. What they track is where practitioners see results move, and for eight years that has shifted toward reviews.
62. The full 2026 split: Google Business Profile signals 32%, reviews 20%, on-page 15%, behavioural 9%, links 8%, citations 6%, personalisation 6%, social 4%. (Whitespark, Local Search Ranking Factors, 2026) Profile and reviews together are over half of the pack. Links and citations, the classic SEO levers, are 8% and 6%. Read it as a budget: where the experts would spend effort, not a formula Google published.
63. Four of the 15 top local pack factors are review factors. (Whitespark, Local Search Ranking Factors, 2026) High Google rating is #6 of 187, quantity of reviews with text #9, recency #11, sustained influx over time #14. Rating, text, recency, rhythm: that is the whole brief in four lines. None of the four is review count on its own. The count only ranks when the reviews carry text (item 66).
64. Bursts lose twice. (Whitespark, Local Search Ranking Factors, 2026; Reviewflowz × Cartelis, Gone in 7 days, 2026) Experts rank a sustained influx of reviews rather than bursts #14 for ranking, and in our data a review posted on a spike day is deleted 1.8 times more often. One is an opinion survey, the other a measurement, and they point the same way. A set of reviews that lands in a day is worth less than the same reviews over weeks.
65. Recency ranks #11 and decays. (Whitespark, Local Search Ranking Factors, 2026; Reviewflowz × Cartelis, Gone in 7 days, 2026) Darren Shaw says a business whose reviews stop coming loses rankings even with 10,000 of them. Half of Google's deletions hit reviews under 30 days old, so the recency that ranks is the recency Google scrutinises. A stock of old reviews is not a ranking asset. The date of the latest one is.
66. Text matters: reviews with text rank #9, ratings without text #38, keywords in reviews #36. (Whitespark, Local Search Ranking Factors, 2026) A star-only rating sits far below a written one. Keywords in the review text sit mid-table, so the text itself counts more than what it says. Do not read this as a reason to ask for keywords. It is a reason to ask for a sentence.
67. Reviews rank the map pack, not the organic result. (Whitespark, Local Search Ranking Factors, 2026) Review signals are 6% of local organic weight, and a high Google rating is #81 of 187 organic factors. So reviews move the three-pack and the map, and barely move the blue links under it. If your traffic comes from organic pages, reviews are a conversion lever there, not a ranking one.
68. For AI search visibility, review signals are 16% of the weight, second only to on-page at 24%. (Whitespark, Local Search Ranking Factors, 2026) Authority of third-party review sites is #5 of 187, and 7 of the top 20 AI visibility factors are review factors. These are expert estimates of a new surface, so treat them as a first map. The direction is clear: AI answers lean on reviews, and on reviews from more than one site.
69. AI rewards breadth: diversity of third-party review sites is #11 for AI visibility but #105 for the local pack. (Whitespark, Local Search Ranking Factors, 2026) The same factor, far apart on the two lists. For the map pack, Google reviews are what count. For an AI answer, each additional review site adds weight. A business that lives on one platform is well placed for one surface and exposed on the other.
70. Low Google ratings of 1 to 2 stars are the #4 negative ranking factor of 42. (Whitespark, Local Search Ranking Factors, 2026) Negative sentiment in Google reviews is #11, and no owner responses at all is #36. The rating hurts rankings more than the words do, and silence hurts least, but all three are on the list. Note the asymmetry with item 29: replies do not rank you up, but never replying is a mild mark against.
71. Reviews are the #2 ranking factor of 16 for Local Services Ads, behind budget and bidding. (Whitespark, Local Search Ranking Factors, 2026) Local Services Ads are Google's pay-per-lead ads for service trades, and in them reviews come right after money. If you buy those leads, the review profile sets what the budget buys. It is the one surface where reviews and spend compete directly.
72. Reviews with photos enter Whitespark's ranking list at #43. (Whitespark, Local Search Ranking Factors, 2026; Reviewflowz × Cartelis, Gone in 7 days, 2026) In our data, 1.1% of new reviews with a photo are deleted within a week against 1.8% without, a gap that shrinks within the margin of error once controlled. So a photo is a modest ranking signal and not a deletion shield. Readers want them (item 84), which is the better reason to ask.
73. An up-and-coming profile needs 5 to 10 reviews as soon as possible, then a steady stream. (Whitespark, Local Search Ranking Factors, 2026) That is Sam Sarsten of Local SEO Academy, a Whitespark contributor, and it is advice, not data. It squares with the data elsewhere here: the conversion curve flattens after ten (item 89), a steady stream beats bursts (item 64), and recency decays (item 65).
How people read reviews

74. 97% of US consumers read online reviews for local businesses, and 41% always do. (BrightLocal, Local Consumer Review Survey, 2026) The always share is up from 29% in 2025. Reading is universal. The news is intensity: a rising share of buyers checks every time, not only for the big purchase. That is the behaviour the rest of this section unpacks.
75. Consumers use six different review sites on average when choosing a business. (BrightLocal, Local Consumer Review Survey, 2026) Six, not one. The number is an average from a survey, so some people use one site and some use ten. What it rules out is the idea that Google alone is the shop window. It is the front door, and item 69 shows AI search leaning the same way.
76. Google is still first but slipping: 71% use it for local business reviews, down from 83%. (BrightLocal, Local Consumer Review Survey, 2026) Apple Maps nearly doubled to 27% from 14%. Local news sites fell to 29% from 48%. These are year-on-year survey shifts and large ones, so expect some noise in them. The direction is steady: Google's share of attention is spreading out, not collapsing.
77. 45% use ChatGPT or other generative AI tools for local business recommendations, up from 6% a year earlier. (BrightLocal, Local Consumer Review Survey, 2026) That puts AI tools third behind Google and Facebook. A jump from 6% to 45% in a year is adoption at speed. The survey does not say how often, only that they do. Read it as the surface that grew fastest, with item 68 as the ranking side of it.
78. 40% trust AI platforms for local recommendations, 32% do not, and 42% trust AI recommendations as much as traditional reviews. (BrightLocal, Local Consumer Review Survey, 2026) Trust lags use: 45% use the tools (item 77) and 40% trust them. The split is close to even, with a large undecided middle. For a business it means the AI answer is read with the same scepticism as a review, and the answer is built from reviews (item 68).
79. 82% of US consumers read AI-generated review summaries. (BrightLocal, Local Consumer Review Survey, 2026) 23% would decide on the summary alone. 59% use it as a starting point, then check ratings or read full reviews. So the summary is the new first impression, and for most readers it is a door, not a verdict. The summary is built from review text, which is why item 66 matters twice.
80. The platform shapes the review: the same Texas hotels average 0.3 stars lower on TripAdvisor than on Expedia. (Proserpio and Zervas, Online Reputation Management (Marketing Science), 2017) An Expedia review is 201 characters, a third of a TripAdvisor review. Same hotels, same period, different audience and different form. A rating is not a property of the business alone. It is the business as seen through one platform's reviewers, so compare profiles within a platform, never across.
81. What readers see on Google: 91% of reviews are three stars or more, and one-star and two-star reviews are 9% of the stock. (Reviewflowz × Cartelis, Gone in 7 days, 2026) That is across 4.9 million reviews on 9,048 profiles. The reader's baseline is positive, so a negative review stands out by rarity. It also sets the scale for item 37: negatives are rare in the stock and common in deletions.
82. Trustpilot reports 64 million monthly active users and 140 billion on-site widget impressions a year. (Trustpilot, Trust Report 2025, 2025) The second number is the larger story: Trustpilot stars are shown on businesses' own sites far more than on Trustpilot. Reach, in review terms, is where the stars are shown, not where they are written.
83. What makes a review count: 56% say it is backed by other reviews with similar sentiment, first of ten factors. (BrightLocal, Local Consumer Review Survey, 2026) Long and detailed comes last at 26%. Readers trust a pattern, not a paragraph. One review persuades less than several short ones that agree. That is also the case against length in item 112.
84. 44% want a review posted within the last month, 36% want a photo or video with it, 35% want a named reviewer. (BrightLocal, Local Consumer Review Survey, 2026) Three attributes readers look for in the review itself: fresh, illustrated, signed. Each is a minority preference, and together they describe the review a reader finds credible. Note the overlap with what Google scrutinises: fresh reviews are the ones most deleted (item 35).
85. Reviews lead to more reviews: 37% read more reviews after reading a positive one. (BrightLocal, Local Consumer Review Survey, 2026) A positive review does not close the question, it opens the next one. More than a third keep reading, which is the same behaviour as item 101, where 66% do further research.
86. Photos now outnumber reviews: travellers submitted 38.1 million photos and videos to Tripadvisor in 2024 against 31.1 million reviews. (Tripadvisor, Transparency Report, 2025) On one platform, in one year, visual contributions overtook written ones. It is a Tripadvisor number and travel is a visual category, so do not assume the same ratio elsewhere. It does fit the 36% of readers who want a photo with the review (item 84).
What reviews are worth: trust, decisions, revenue

87. Losing reviews does not move the rating. It moves count and recency, which is what buyers filter on. (Reviewflowz × Cartelis, Gone in 7 days, 2026; BrightLocal, Local Consumer Review Survey, 2026) Businesses that lost five or more reviews saw their average move by 0.01 star. On the buyer side, 47% will not use a business with fewer than 20 reviews and 74% want reviews from the last three months. So a deletion is cheap in stars and expensive in the two things a buyer checks first.
88. A product with five reviews is 270% more likely to be bought than a product with none. (Spiegel Research Center, How Online Reviews Influence Sales, 2017) Measured on 1,800 products and 15.5 million page views. The lift is 190% for a lower-priced product and 380% for a higher-priced one. This is e-commerce, product pages, not local businesses, and the base is zero reviews. The percentage shrinks fast as the base rises (item 89).
89. The first five reviews do most of the work, and nearly all of the gain comes within the first ten. (Spiegel Research Center, How Online Reviews Influence Sales, 2017) Higher-priced items need at least five, lower-priced ones two to four. The curve is steep then flat: past the tenth review, conversion barely moves. The flat part is not useless. It is where recency and rating take over (items 65 and 102).
90. One extra Yelp star is worth 5 to 9% more revenue for an independent restaurant. (Luca, Reviews, Reputation, and Revenue (Harvard Business School), 2016) Seattle, 2003 to 2009, and for chains the effect is 0.5% and not significant. The study uses Yelp's rounding to isolate the rating's effect, so it is causal, not a correlation. It is restaurants, one city, one platform. Take the direction and the order of magnitude, not the decimal.
91. A rating change has 50% more revenue impact for a restaurant with 50 or more reviews than for one with fewer than 10. (Luca, Reviews, Reputation, and Revenue (Harvard Business School), 2016) A rating backed by more reviews moves revenue more. So a star is not worth the same to every business: it is worth more once the count is credible. Item 100 gives the same finding from the other side.
92. Chain restaurants lost market share to independents as Yelp spread through Seattle. (Luca, Reviews, Reputation, and Revenue (Harvard Business School), 2016) Chains do not gain from a star (item 90), and they lost ground as reviews became available. The reading is that reviews substitute for a brand: when a buyer can check an independent, the chain's reassurance is worth less. It is one city and one period, and it is the clearest evidence here that reviews move money, not only opinions.
93. A verified buyer badge raises purchase likelihood by 15%. (Spiegel Research Center, How Online Reviews Influence Sales, 2017) The badge, not the rating. Pair it with item 11: verified buyers also rate higher. Both are e-commerce findings from product pages, where the badge exists. Read them as the value of provenance, not as a local-business figure.
94. 49% of US consumers trust online reviews as much as personal recommendations. (BrightLocal, Local Consumer Review Survey, 2026) 85% say positive reviews make them more likely to use a business, and 77% say negative ones make them less likely. Half of readers put a stranger's review on a par with a friend's word. The two influence numbers are near-symmetric, so a negative review costs about what a positive one earns.
95. 93% of US consumers have made a purchase after reading reviews. (BrightLocal, Local Consumer Review Survey, 2026) 27% have spent more than $1,000 and 13% more than $5,000 after reading them. These are lifetime recollections, not a conversion rate. What they establish is that reviews sit in the path of large purchases, not only cheap ones.
96. 70% have made a purchase they regretted after reading reviews. (BrightLocal, Local Consumer Review Survey, 2026) Reviews do not prevent bad decisions. They precede most purchases, good and bad. The number is a check on item 95: reading reviews is near-universal, so regret after reading is near-universal too. It is also the demand behind every fake-review number in the enforcement section.
97. After reading positive reviews, 54% visit the website, 34% are ready to buy, 20% contact the business and 20% book. (BrightLocal, Local Consumer Review Survey, 2026) The website share has risen from 32% in 2019. For most people the next step after a good review is a visit, not a purchase, so the site is where a review's effect lands.
98. Whitespark's experts rank a high Google rating the #1 conversion factor of 120. (Whitespark, Local Search Ranking Factors, 2026) Positive review sentiment is #2, review count #5, recency #7. This is the conversion list, the factors that turn a searcher who already sees you into a customer, not the ranking list. Reviews own the top of it. The ranking side is item 63.
99. Five of the ten top conversion factors are review factors. (Whitespark, Local Search Ranking Factors, 2026) Half of what the experts think converts a local searcher is reviews, and item 98 lists which ones. It is an opinion survey. What makes it credible is the agreement with the measured numbers in items 88 to 91.
100. A restaurant that reaches 50 reviews becomes roughly 20% more rating-sensitive than it was under 10. (Luca, Reviews, Reputation, and Revenue (Harvard Business School), 2016) Same finding as item 91, tracked within a business as its count grows. The star rating gains leverage as the count behind it grows. For a young profile the lesson runs the other way: with few reviews the rating moves little, and the count is the first lever.
101. Reviews start the decision more than they close it: 66% do further research after reading a positive review. (BrightLocal, Local Consumer Review Survey, 2026) Two thirds keep going. A positive review buys the next look, not the sale. Put with items 85 and 97, the pattern is consistent: read, read more, visit, then decide. The review's job is to get a business onto the shortlist.
What a profile needs: count, recency, rating

102. Too perfect costs twice. (Reviewflowz × Cartelis, Gone in 7 days, 2026; Spiegel Research Center, How Online Reviews Influence Sales, 2017) Profiles with 85% or more five-star reviews lose 2.2 times more reviews to Google, and purchase likelihood peaks between 4.0 and 4.7 stars then falls toward 5.0. In no product category is 5.0 the optimum. One finding is from Google profiles, the other from e-commerce products, and they agree: a spotless record reads as suspicious to the platform and to the buyer.
103. In profiles rated 4.8 and above, a four-star review is deleted nine times more often than in profiles under 4.5. (Reviewflowz × Cartelis, Gone in 7 days, 2026) A four-star review is a good review, and in a near-perfect profile it is the odd one out. The same review faces nine times the risk depending on the profile it lands in. The number says that a review's context, not only its content, drives deletion.
104. The reviews buyers want most are the ones at risk. (Reviewflowz × Cartelis, Gone in 7 days, 2026; BrightLocal, Local Consumer Review Survey, 2026) A review under two weeks old is about 100 times more likely to be deleted than one over three years old, and 32% of consumers now look for reviews from the last two weeks, up from 20% in 2025. 74% want reviews from the last three months, and 18% are only swayed by reviews from the last week. The freshness buyers demand sits exactly in the window Google screens.
105. 47% will not use a business with fewer than 20 reviews, and only 9% would use one with five or fewer. (BrightLocal, Local Consumer Review Survey, 2026; Spiegel Research Center, How Online Reviews Influence Sales, 2017; Whitespark, Local Search Ranking Factors, 2026) Spiegel's conversion curve flattens after ten, and Whitespark's experts say get 5 to 10 fast, then a steady stream. Three sources, three thresholds: 5 to 10 to exist, 10 for most of the conversion gain, 20 to stop losing half the readers. A survey, a product study and an expert poll, and they stack rather than contradict.
106. 68% will only use a business rated 4 stars or more, up from 55% in 2025. (BrightLocal, Local Consumer Review Survey, 2026) 31% insist on 4.5 or more, up from 17%, and 10% on five. The floor is rising fast. A rating under 4.5 now loses the 31% who insist on it, where a year ago it lost 17%. Read it with item 102: the target is high, not perfect.
107. 92% care about the star rating when choosing a business. (BrightLocal, Local Consumer Review Survey, 2026) Near-universal, and the least surprising number in the list. Its use is as the denominator for item 106: almost everyone looks at the rating, and a growing share has a hard cut-off. The rating is not one signal among many. It is the first filter.
108. Half a star is a cliff. (Luca, Reviews, Reputation, and Revenue (Harvard Business School), 2016; Proserpio and Zervas, Online Reputation Management (Marketing Science), 2017) Yelp shows a 3.24 average as 3 stars and a 3.25 as 3.5, and that display step is worth roughly 9% in revenue. 27% of hotels that started replying crossed a half-star threshold within six months. The platforms round, and readers react to the rounded number, so the same business can be worth 9% more on the step from 3.24 to 3.25.
109. 4.2 to 4.7 beats 4.7 to 5.0: products in the lower band are more likely to be bought. (Spiegel Research Center, How Online Reviews Influence Sales, 2017) It is a product-page finding, and it is the buyer-side half of item 102. A profile that climbs from 4.7 toward 5.0 is not gaining. It is spending credibility. The practical reading is that a few critical reviews on a strong profile are not a problem to solve.
110. Trustpilot seeds every TrustScore with seven reviews at 3.5 stars. (Trustpilot, trust page, 2026) So a profile with few reviews starts from a balanced score rather than its first rating. A new Trustpilot profile with one five-star review does not show a five-star score. It also means a young TrustScore understates a good business until the real reviews outweigh the seven.
111. At the observed pace a profile loses about 1.4% of its reviews a year, about 0.75% a year for reviews older than three months. (Reviewflowz × Cartelis, Gone in 7 days, 2026) Extrapolated from two weeks of crawling, so it is a pace, not a forecast. The two rates say the same thing as item 35: most of the loss is new reviews. A profile that stops collecting also stops losing, and loses the recency that ranks (item 65).
112. Length does not help anyone. (BrightLocal, Local Consumer Review Survey, 2026; Reviewflowz × Cartelis, Gone in 7 days, 2026) Long and detailed is the least important factor for readers at 26%, and review length makes no difference to deletion inside the same business, 1.04x. A short review that agrees with others (item 83) is worth more to a reader than a long one, and it is no more or less likely to survive. Ask for a sentence, not an essay.
The full method behind our own numbers, the sample of 9,048 profiles, the two-week crawl window and the exclusions, is in the study PDF: Reviewflowz × Cartelis, Gone in 7 days, 2026.